When betting at the line on sports that accrue points in multiple, rather than in single increments, it is important to be aware of historical winning margin statistics. This is because a sport’s scoring system can result in key winning margins that occur with greater frequency than other margins. Awareness of these key numbers is beneficial when shopping around for line odds.
Using 2009-2013 data, this article looks at winning margin frequencies for National Rugby League (NRL) fixtures and applies the results to NRL line betting.
NRL Scoring
In rugby league, teams accumulate points in the following increments:
1 point for a successful drop goal
2 points for a successful penalty kick
4 points for an unconverted try
6 points for a converted try
A “golden point” sudden death overtime period applies if scores are level at full-time, however a draw results if neither team scores in overtime.
Winning Margin Frequencies
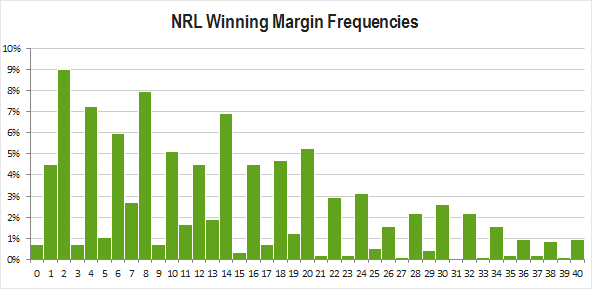
Winning margin frequencies have been calculated using NRL results from the beginning of the 2009 season through to Round 21 (August 9-12) of the 2013 season. In total, 956 games were included in the survey. The observed winning margins ranged between 0 and 64 points, however 0-40 have been graphed due to the fact that this range accounted for 98.4% of the margins. The results table can be found at the bottom of this article. Note that the winning margins are shown on the x-axis and the margin frequencies are on the y-axis. For example, 9% of NRL games since 2009 were won by 2 points.

From the graph we can make the following observations:
- The winning margin was most often an even number. Because drop goals are generally only applied under certain circumstances, the most common means of accumulating points are in increments of 2, 4 and 6. Since 2009, just 17.8% of the winning margins were odds numbers.
- There is a general downward trend in the frequency of higher winning margins.
- The most common winning margin was 2, followed by 8, then 4, then 14.
- A trend can be seen with local peaks every 6 points starting with 2 (2, 8, 14, 20). This trend dies away after 20 points.
- A 1-point margin was the most common of all the odd-numbered winning margins. As with the even numbers, a trend can be seen where the frequency of the odd-numbered margins peaks every 6 points (1, 7, 13, 19, 25). This is consistent with common sense because the most likely scenarios for kicking a drop goal are when the scores are tied or when one point will put the score more than X converted tries out of reach.
Application to Line Betting


Based on the above margin frequencies the key line numbers to look out for are 2, 4, 6, 8, 10, 14 and 20. These seven margins accounted for 47.4% of all winning margins in the NRL since 2009.
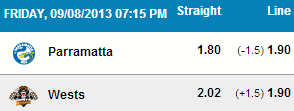
Using the number 2 as an example, a sharp better will shop around for -1.5 and +2.5 margins rather than -2.5 or +1.5 to ensure they are on the correct side of the key number. For line/handicap betting you should look to pick lines that are 0.5 points ABOVE a key number. For example, on the right are two sets of bookmaker odds for an upcoming Parramatta Eels vs. Wests Tigers game. Given that 2 is a key number, accounting for 9% of all winning margins since 2009, the -1.5 margin bet on Parramatta is a far better option than -2.0 with the first bookmaker. In the event that Parramatta did win by 2 points the first wager would result in a push while the second wager would be a winning bet. Without knowing anything else about the game you would expect the push scenario to have a 9% chance of occurring. This gives significant added value to selecting the -1.5 line rather than -2.0.
Pick Your Own Line Betting

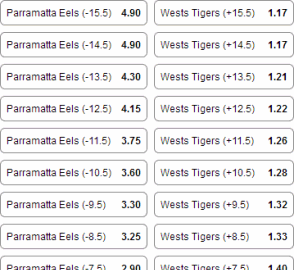
The image on the right shows a selection of “pick your own line” options for the Parramatta vs. Wests game. Pick your own line markets enable you to select the level of risk by picking the line/handicap of your choosing.
The results from the winning margin survey above tie in well with the odds on offer to the right. Note that the bookmaker offers the same odds for -15.5 and -14.5 due to the fact that 15 is not a key number in NRL winning margins. At the same time there is a substantial drop from -14.5 to -13.5 due to the fact that a 14-point winning margin accounts for almost 7% of NRL results since 2009.
Summary
When betting on sports where points can be accumulated in increments above 1 it is important to study historical winning margin frequencies for line betting. This enables you to establish the key numbers to stay half a point above when shopping around for lines. For the NRL the key numbers, based on 2009-13 data, are 2, 4, 6, 8, 10, 14 and 20. These seven numbers account for almost half of the winning margins since 2009. Using the number 2 as an example, when most bookmakers are offering 2.0 lines, it is worth shopping around to see if you can get -1.5 for the favourite or +2.5 for the underdog. In contrast, there is little difference in value between -14.5 and -15.5 due to the low occurrence of a 15-point winning margin.
Full Results Table
The table below contains the observed winning margins, ranked by frequency.
| Winning Margin | Frequency | Cumulative Frequency |
|---|---|---|
| 2 | 9.0% | 9.0% |
| 8 | 7.9% | 16.9% |
| 4 | 7.2% | 24.2% |
| 14 | 6.9% | 31.1% |
| 6 | 6.0% | 37.0% |
| 20 | 5.2% | 42.3% |
| 10 | 5.1% | 47.4% |
| 18 | 4.7% | 52.1% |
| 1 | 4.5% | 56.6% |
| 12 | 4.5% | 61.1% |
| 16 | 4.5% | 65.6% |
| 24 | 3.1% | 68.7% |
| 22 | 2.9% | 71.7% |
| 7 | 2.7% | 74.4% |
| 30 | 2.6% | 77.0% |
| 28 | 2.2% | 79.2% |
| 32 | 2.2% | 81.4% |
| 13 | 1.9% | 83.3% |
| 11 | 1.7% | 84.9% |
| 26 | 1.6% | 86.5% |
| 34 | 1.6% | 88.1% |
| 19 | 1.3% | 89.3% |
| 5 | 1.0% | 90.4% |
| 36 | 0.9% | 91.3% |
| 40 | 0.9% | 92.3% |
| 38 | 0.8% | 93.1% |
| 0 | 0.7% | 93.8% |
| 3 | 0.7% | 94.6% |
| 9 | 0.7% | 95.3% |
| 17 | 0.7% | 96.0% |
| 25 | 0.5% | 96.5% |
| 29 | 0.4% | 97.0% |
| 44 | 0.4% | 97.4% |
| 15 | 0.3% | 97.7% |
| 46 | 0.3% | 98.0% |
| 21 | 0.2% | 98.2% |
| 23 | 0.2% | 98.4% |
| 35 | 0.2% | 98.6% |
| 37 | 0.2% | 98.8% |
| 42 | 0.2% | 99.1% |
| 50 | 0.2% | 99.3% |
| 56 | 0.2% | 99.5% |
| 27 | 0.1% | 99.6% |
| 33 | 0.1% | 99.7% |
| 39 | 0.1% | 99.8% |
| 41 | 0.1% | 99.9% |
| 64 | 0.1% | 100.0% |
